Géoclip geostatistical observatories


DRAW UP PORTRAITS OF TERRITORIES THROUGH GEOSTATISTICAL OBSERVATORIES IN WEB MODE

Géoclip is a web mapping solution for all geo-observation, geo-analysis, geo-reporting and communication needs. Géoclip is published by Business Geografic, our business unit specializing in innovative geomatics.

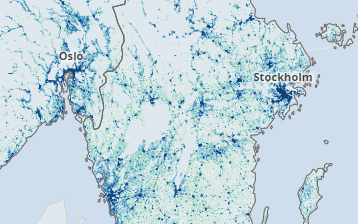
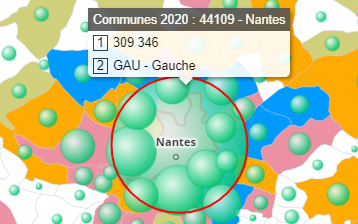
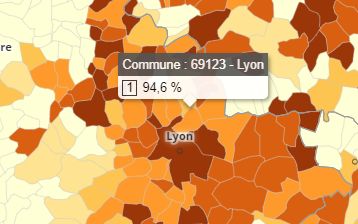
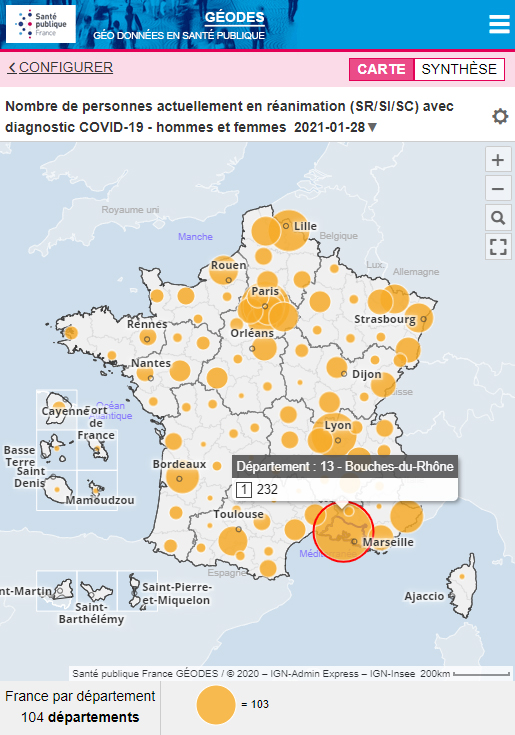
Géoclip was born in the early 2000s. Our teams of GIS engineers and statisticians dedicated their scientific knowledge and technical know-how to a simple yet ambitious goal: make geostatistical data accessible to the greatest number of people. Géoclip enables you to create geostatistical observatories to visualize, explore, compare and analyze all kinds of localized data and indicators related to your territory. Take the most of drill up and down capabilities of the maps, graphs, tables and reports included within Géoclip: all representation modes are fully interactive and dynamically linked to each other. The data observation approach is completely open, leaving you free to navigate as you wish between themes and geographical scales, without constraints nor imposed scenarios, with a structured or unstructured exploratory approach.  

Observatories based on Géoclip are flourishing at exponential speed in Europe and beyond. Their semiological relevance and quality make the difference; they promote shared knowledge of territories.


TELL US MORE ABOUT YOUR NEEDS:
> PLEASE CONTACT US!


Géoclip offer and services


SOFTWARE PRODUCT

Create meaningful geostatistical observatories in responsive HTML5 mode based on your data and indicators; host them in our SynAApS datacenters for optimal security and share them with your audiences.

> SOFTWARE PRODUCT


DATA COLLECTIONS

Enrich your databases with localized thematic and statistical data. We, Business Geografic, collect, gather, structure, consolidate and document public geostatistical data for you.

> ASK FOR MORE INFORMATION


CUSTOMER SERVICES

Rely on the experts. We advise, train and support you all along the lifecycle of your projects, following a renowned project management methodology and high quality guarantees.

> CUSTOMER SERVICES


Géoclip demonstrations


Try the Géoclip demo applications we have prepared for you; you'll get a first glimpse of the geostatistical features and representation modes coming with Géoclip.

There are many reasons why Géoclip is so popular. The power of simple and comparative analyses at all cartographic scales, the precise localization and rendering of data and indicators, the complementarity nature of graphic and cartographic representation modes, etc. are some of these reasons. Make up your own mind: try it yourself!

Please note that most customers publish their Géoclip observatories in public web mode: don't hesitate to visit their geostatistical observatories as well. Our Business Geografic teams are also available to put you in touch with our Géoclip Customers and Partners.


FOCUS ON "FRANCE DÉCOUVERTE"
THE GEOSTATISTICAL OBSERVATORY OF FRANCE

 
France Découverte is the most exhaustive geostatistical observatory of France in public web mode. 

Initially created for demo purposes, France Découverte has very quickly become an application, dare we say it, of public utility.

Territorial actors and decision-makers from all horizons, as well as statisticians, researchers, journalists, teachers, students, etc. have saved France Découverte in their web favorites in order to visualize, analyze and follow the French territorial, economic, political, socio-demographic, cultural, health, etc. news from a geostatistical perspective. 

Our Business Geografic teams carefully collect, compile, document, keep up to date and enrich the data included in - or linked to - this Géoclip observatory, in order to provide you with information that is as precise and accurate as the data allows. If you haven't already done so, add France Découverte to your web favorites so that you too can benefit from the richness of this showcase geostatistical observatory! 


> LINK

Démonstration Géoclip - Europe Découverte


EUROPE DÉCOUVERTE


This European observatory processes more than 2 million tiles to highlight population estimation data per 1-kilometer tile with remarkable performance and precision. This observatory will enable you to observe the urbanization and settlement patterns of the European population as a whole, for instance; you'll also be able to note the disparities from one country to another. 


> LINK

Démonstration Géoclip - Observatoire des Votes


VOTING OBSERVATORY


Visualize the electoral results of elections in France since 1995. This observatory is being enriched after each election with official data issued from the French government; the results, available down to the electoral district level, are contextualized using contextual data from other Géoclip observatories, thanks to the TJS protocol that allows observatories to communicate with each other.


> LINK (FR)

Démonstration Géoclip - Observatoire des Télécoms


TELECOM OBSERVATORY


This FTTH optical fiber deployment observatory is based on data from the French Arcep, supplemented and cross-referenced with data from the French Insee. Discover in particular the comparative temporal analyses to retrace the temporal evolution of the deployment of optical fiber on a selection of territories and compare it to that of the French territory as a whole.


> LINK (FR)

GÉOCLIP CUSTOMER OBSERVATORIES


Ministries, local authorities, statistical offices, urban planning agencies, health laboratories and organizations, etc.: Géoclip attracts many and varied public and private structures working in all fields of activities.

Géoclip meets the needs of geo-observation, geo-analysis, geo-reporting and communication needs; Géoclip inherits our know-how in the fields of statistical processing, cartographic rendering and graphic semiology. Experts from all cultures and backgrounds have joined Business Geografic and enriched our software product over the years; our customers and users also contribute to influencing our Géoclip product developments.

Discover below a short selection of Géoclip client observatories; you will find more customer references on our Géoclip dedicated website.  


business geografic geoclip sante publique france geodes

SPOTLIGHT ON GÉODES
TO MONITOR THE COVID-19 PANDEMIC IN FRANCE

 
Santé publique France
 is the national public health agency in France. Its vocation is to watch, monitor, prevent, alert and act on multiple topics related to public health in France. Informing the general public is one of its missions; the agency relies for this on Géodes, its geostatistical observatory based on Géoclip that gathers hundreds of health monitoring indicators related to the French territory.

March 2020: France and many other countries enter a global health crisis linked to the Covid-19 coronavirus pandemic. As part of its information missions, Santé publique France began releasing data related to this crisis as early as March 18, 2020 via its Géodes geostatistical observatory based on Géoclip.

Since then, countless political leaders, healthcare professionals, local and regional economic players, business leaders, journalists, citizens, etc. have been observing, analyzing and communicating on the data gathered within the Géodes geostatistical observatory. 

Géodes is a reporting and communication tool for Santé publique France, who releases a daily epidemiological report including many and varied geostatistical indicators related to public health in France. 

"Géodes includes 80+ indicators related to Covid-19. We've chosen to disseminate the whole existing data as it becomes available; for public service and transparency considerations, we have decided that all of our indicators will be available to everyone", explains Étienne Lucas, Scientific Research Officer at Santé publique France and Administrator of the Géodes observatory. 
 
 
> LINK (FR)


LOCAL HEALTH (ENGLAND)


"Local Health" is Public Health England's geostatistical observatory. This Géoclip application contributes to making health data accessible to the greatest number of people, providing quality-assured health information at small area level. Select a geographical area, the area profile will pop up on your screen. Give it a try!


> LINK


DIGITAL ATLAS OF BELGIUM


The "Atlas of Belgium" was released some years ago by the Geomatics unit of the University of Liège in Belgium; it has since been migrated to the latest version of Géoclip. Get off the beaten track, explore the Belgian territory from a thematic and geostatistical perspective thanks to this multilingual Géoclip observatory!


> LINK


ATLAS INTERACTIVO DE ESPAÑA


The Spanish Instituto Geográfico Nacional selected Géoclip to create its "Atlas interactivo nacional de España". Choose your indicators, adjust the settings of the representation modes, drill up and down the data to visualize, analyze and compare the indicators of your choice... all at your fingertips!


> LINK


PUBLIC CID OF CANADA


The public "Community Information Database" (CID) of Canada provides access to consistent and reliable socio-economic and demographic data for all communities across the 10M km² of Canada. It comes with an observatory that enables to visualize a hundred or so geostatistical indicators sorted by theme and year. Yours to discover!


> LINK 


POPGIS (PACIFIC REGION)


The "PopGIS" observatories form a family that is growing steadily thanks to the Pacific Community, whose mission is to support the States and Territories of the Pacific Region in their sustainable development. No less than 13 Member Regions of the Community already have their own PopGIS geostatistical observatory!


> LINK


STATISTIQUES LOCALES (FRANCE)


"Statistiques locales" is the geostatistical observatory of the French Insee (national Institute of statistics), who publishes all the data and indicators it produces, analyzes, updates and enriches constantly. A wealth of information and a national reference observatory for both professionals and the general public!


> LINK 

Go one more step beyond with Géoclip


Géoclip brings the worlds of GIS and statistics closer together. We, Business Geografic, are proud to combine these two worlds successfully. Should you wish to join the Géoclip user community, please take advantage of our Géoclip resources available online and contact our teams; they'll be glad to get in touch with you.


Webinaires Géoclip
 

GÉOCLIP WEBINARS

Register for our demo webinars to discover Géoclip, ask your questions and submit your geostatistical observatory projects.

> REGISTER


Tutoriels Géoclip
 

GÉOCLIP TUTORIALS

Discover how much Géoclip is feature-rich, easy to use and fast to operate through the video tutorials that we prepared for you.

> WATCH


Documentation Géoclip
 

GÉOCLIP RESOURCES

Business Geografic Customers and Partners, please visit your Help Center to access support and resources dedicated to Géoclip.

> LOG IN


ANY QUESTION OR REQUEST?
> PLEASE CONTACT US!